Visual Probability 2.0

Use Visual Probability to compute and graph probability density functions
3.3 
Rating
Your vote:
Latest version:
2.2 See all
Developer:
Screenshots
1 / 4
Download

Use Visual Probability to compute and graph probability density functions, cumulative distribution functions, survival functions and hazard functions, and get quantile values, means, variances of ten more distributions.

Features

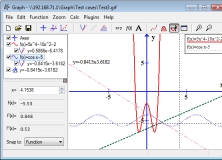
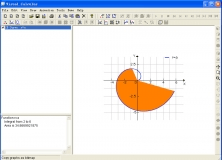
- Compute and graph probability density functions.
- Compute and graph cumulative distribution functions.
- Compute and graph survival functions.
- Compute and graph hazard functions.
- Compute quantile values.
- Compute means and variances .
- Ten more distributions are provided.
- Copy and save graph as bmp format.

Comments

3.3
Rating
98 votes
5 stars
16
4 stars
29
3 stars
26
2 stars
27
1 stars
0
User

Your vote:

Related software

Graph
Graph
Free
rating

It can be used to draw mathematical graphs in a coordinate system.

Grapher
Grapher
rating

Present your data in 2D/3D graphs and perform statistical analysis.

Function Grapher
Function Grapher
rating

Graph maker to create 2D, 2.5D and 3D function graphs.

Visual Calculus
Visual Calculus
rating

It is a mathematical computation and visualization program.

Visual Complex
Visual Complex
rating

Create graphs of complex variable functions.